A singularity, in mostly common parlance, refers to a part of a black hole, the center point of infinite density. But singularities exist in another place in mathematics, and that's where a function is no longer defined at a given point.
Now, sometimes the result of when functions don't exist at given points are asymptotes, dotted vertical lines where the curves shoot off, either up or down, towards infinity and hugging those dotted lines, never to cross.
Other times, mathematical functions will have undefined points, but these will result in holes instead of those pesky asymptotes. These are easy for Algebra students to identify and draw into their sketches, but calculator devices will never show them, because the hole will be too small considering how the calculator's numbering works.
Recently I was examining two functions, trying to estimate what the output of the function would be where the hole would exist. Here're the functions:
Now, I put these here with their colors, red and green, as in a moment I'll display what the graphs look like---the red will be the red graph and the green, the green. So, for a a quick math moment: the problem with the red graph is at the point x=1. For that equation, at x=1, we can finagle the graph to be 0/0, which is a problem, but a problem where we should be able to estimate the output. For the green equation, the problem is at x=0. When x=0 there, again we get 0/0 (big problem), which, again, while problematic, should give us a hole and allow us to estimate the output.
So, stay with me. Here's the graph, with circles around where the holes would be:
So, on the green graph, x=0 is a hole (or would be on an algebra student's graph), and on the red graph, x=1 is a hole. Neither
look like holes, because of he graphical nature of our graphing device, here it being Desmos, a wonderful free online graphing calculator.
How far can we zoom in? Well...let's see...let's take a closer look at the green graph, where the hole should be. Let's zoom in...
Not much happening...
Still not much, but...uh oh, there's some jazz happenings here:
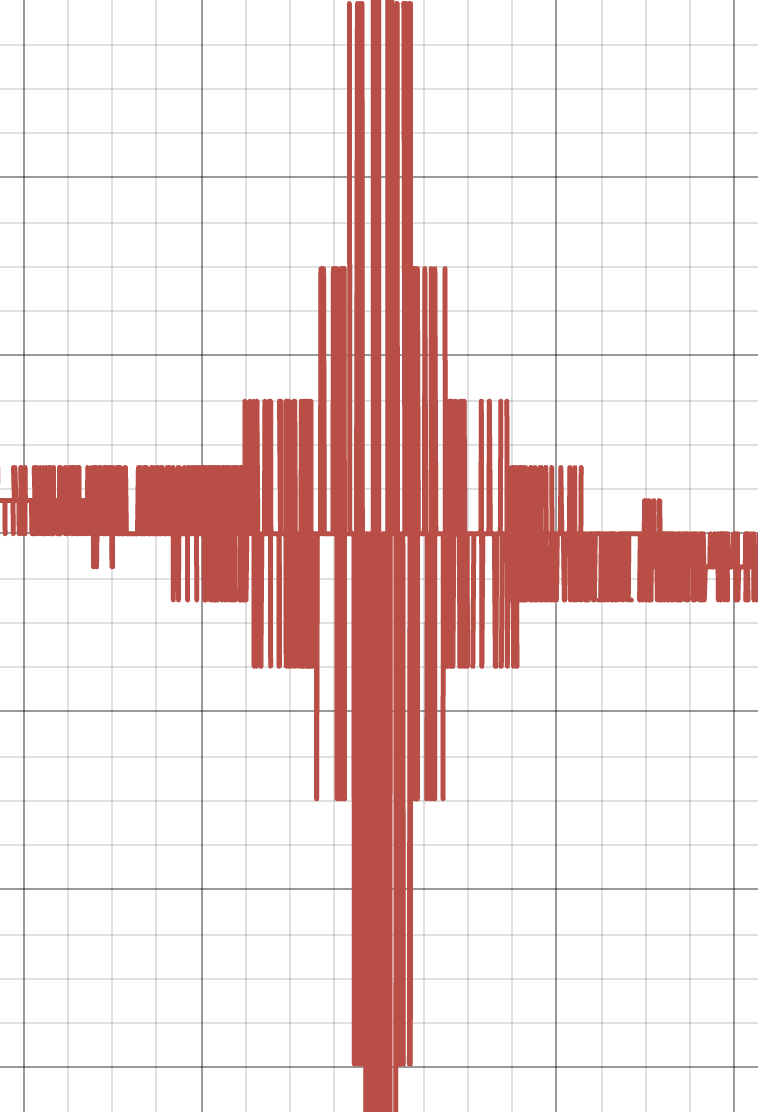
Whoa! This is super close up, and this is the chaos arriving as we approach the singularity. This is the singularity, this is the function breaking down the closer and closer we get to the singularity, the point at which the function ceases to exist:
Let's take a look at the red graph:
Not much happening...let's keep zooming in...
Still need some zooming...
Whoa, there's some jazz, and as we keep zooming, we see the singularity again:
This is where the the function breaks down, as it oscillates back and forth uncontrollably.
The difference between how these singularities look within the confines of Desmos is fascinating.
I've never looked so closely at singularities before. And really, how many of us have?
How many of us have gotten so close to singularities before!


No comments:
Post a Comment